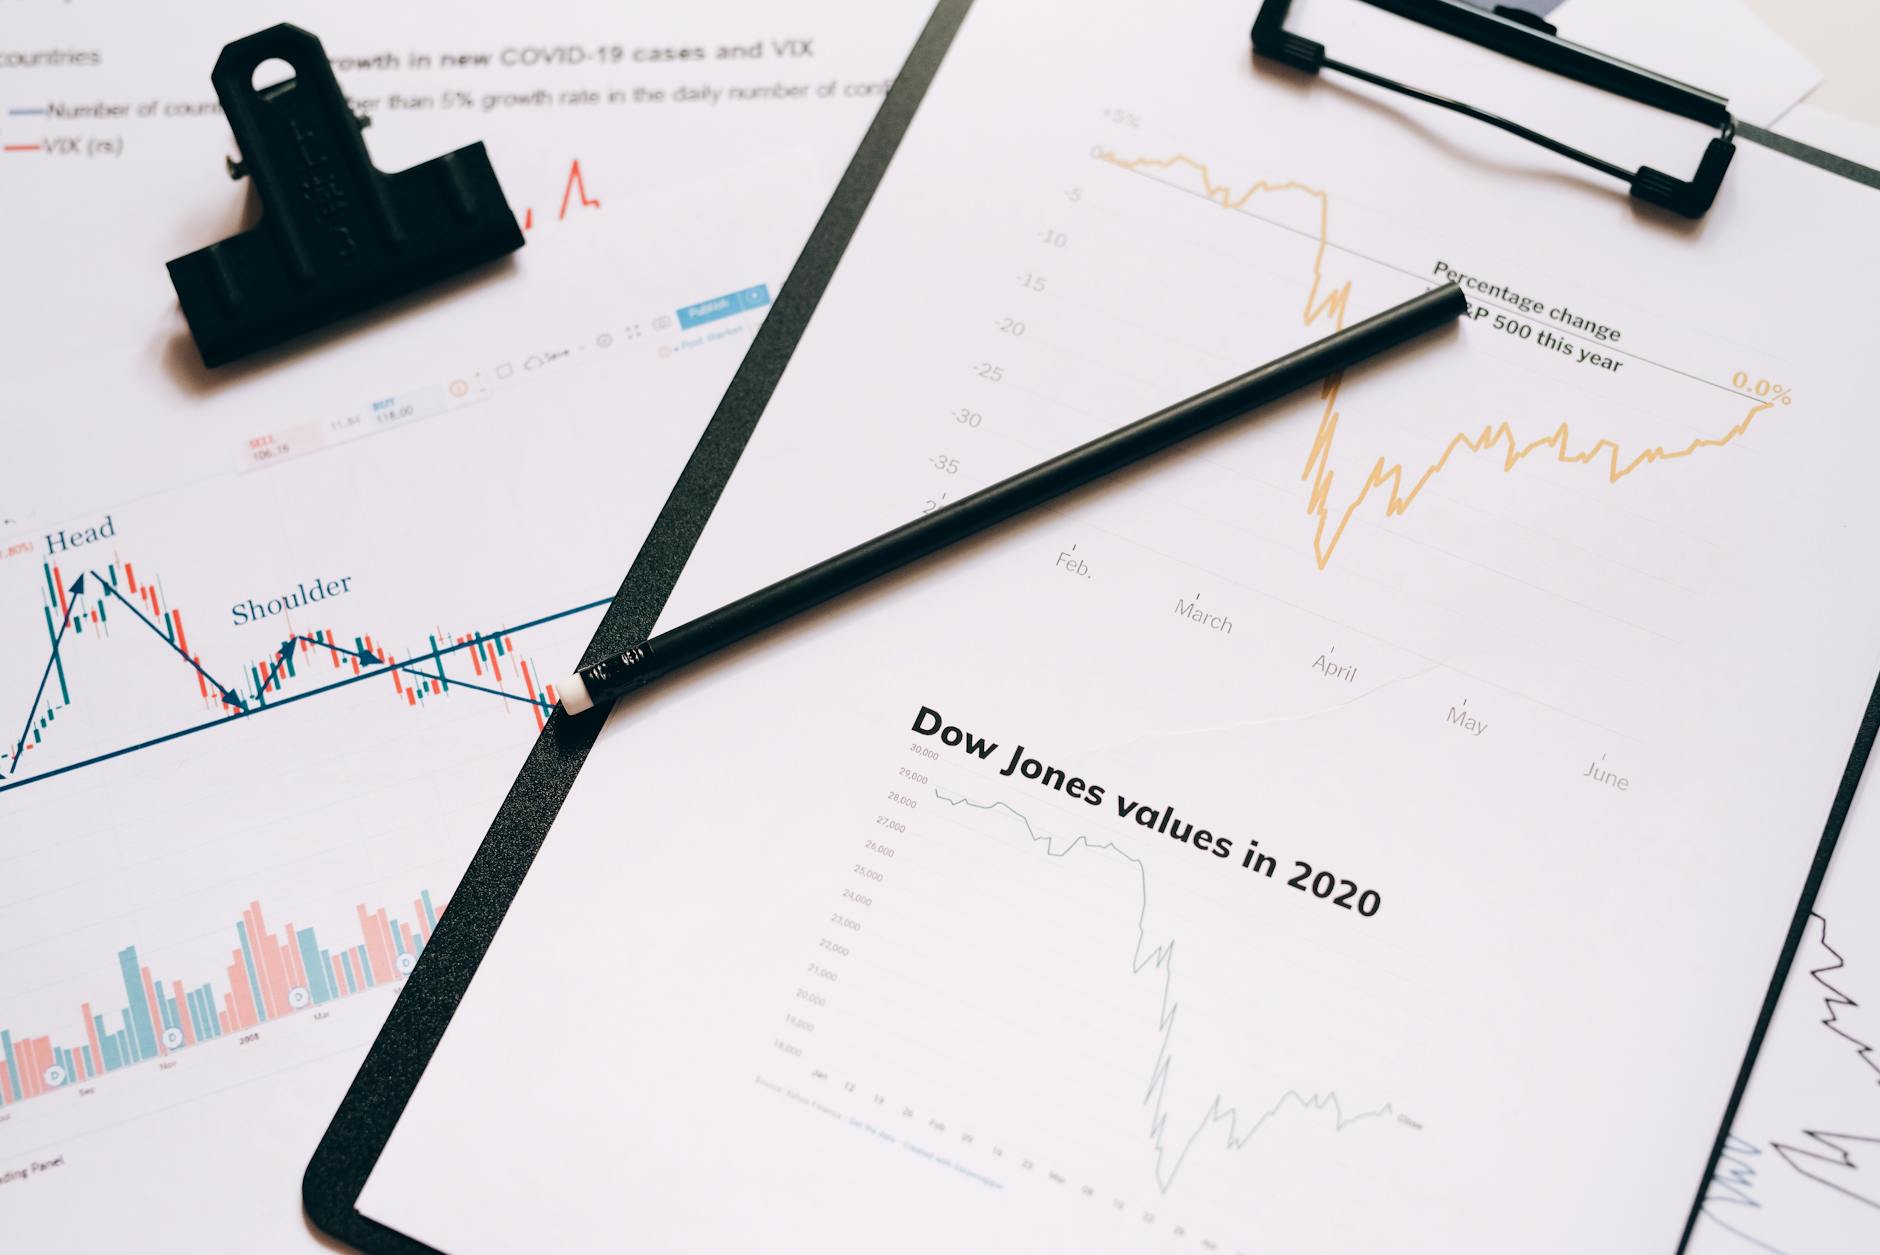
- The Dow Jones Industrial Average is up approximately 5.8% year-to-date through May 9, 2026.
- Financials lead: JPMorgan +14%, Goldman Sachs +18%. Technology lags: Apple -3%.
- Key resistance at 44,280 (record high); support at 41,800 (February low).
- Suitable when Long-term investors seeking value exposure to financials and industrials.
- ❌ Less suitable for: Growth-focused investors expecting tech outperformance through the Nasdaq.
The Dow Jones Industrial Average is up approximately 5.8% year to date through May 9, 2026, driven by a rotation into financials and industrials as the Fed paused its rate-cutting cycle. However, the index has underperformed the tech-heavy Nasdaq, which gained roughly 11% over the same period, reflecting divergent sector leadership. The DJIA's YTD path has been choppy, with three distinct phases: a strong Q1 rally, a sharp April pullback, and a partial recovery in early May.
After a strong start to the year buoyed by easing inflation data and a dovish pivot from the Federal Reserve in late 2025, the Dow hit a new all-time high on March 17, 2026, at 44,280. The gains reversed sharply in April as renewed geopolitical tensions and sticky services inflation, the March core PCE index came in at 2.8% year-over-year, above the Fed's 2% target, led to a repricing of rate-cut expectations.
The Dow closed at 42,900 on May 9, roughly 3% below the March peak. This article breaks down the YTD performance by sector, identifies the biggest winners and losers among the 30 components, and lays out the key technical levels and risks to watch for the rest of the year.
1. Dow Jones YTD Performance: Where We Stand and What Drove the Move
What Is the Dow Jones Industrial Average?
The Dow Jones Industrial Average (DJIA) is a price-weighted index of 30 large, publicly owned US companies. Unlike the S&P 500, which weights by market capitalization, the Dow gives higher influence to higher-priced stocks, which can skew its performance relative to broader benchmarks.
As of May 9, 2026, the DJIA stood at 42,900, representing a year-to-date gain of approximately 5.8% from its 2025 close of 40,650. The index hit a record high of 44,280 on March 17, 2026, but has since retreated 3.1% from that peak.
Key YTD drivers fall into three categories:
- Rate expectations: The Fed cut rates by 50 basis points in January 2026 but has held steady since, with the fed funds rate at 4.25%-4.50%. The market repriced from expecting four additional cuts to just one more cut by December, weighing on rate-sensitive sectors.
- Sector rotation: Gains have been driven by financials (JPMorgan +14%, Goldman Sachs +18%), industrials (Caterpillar +11%, Boeing +8%), and healthcare (UnitedHealth +12%). Tech components like Apple (-3%) and Microsoft (-1%) have lagged as valuation concerns emerged.
- Geopolitical headlines: Heightened tensions in Eastern Europe and renewed trade uncertainty with China in April triggered a broad risk-off move, particularly hitting industrials and materials. The Dow lost roughly 2,000 points between April 2 and April 18.
The table below summarizes the YTD performance of key DJIA components across major sectors:
| Sector | Component Examples | YTD Return (approx.) | Key Driver |
|---|---|---|---|
| Financials | JPMorgan, Goldman Sachs | +14% to +18% | Higher net interest margins, solid earnings |
| Industrials | Caterpillar, Boeing | +8% to +11% | Infrastructure spending, defense demand |
| Healthcare | UnitedHealth, Johnson & Johnson | +7% to +12% | Earnings beats, defensive rotation |
| Technology | Apple, Microsoft | -3% to -1% | Valuation compression, AI spending concerns |
| Energy | Chevron, Exxon Mobil | +2% to +5% | Stable oil prices, capital discipline |
For investors assessing their portfolio exposure, understanding the Dow's YTD composition is a starting point. For a broader view of the market across large caps, see our .
2. Dow Jones YTD vs. S&P 500 and Nasdaq: A Performance Comparison
The Dow's 5.8% YTD gain trails the S&P 500's 7.3% return and significantly lags the Nasdaq's 11.2% advance through May 9. This performance gap tells an important story about market breadth and leadership in 2026.
Why has the Dow underperformed?
- Tech weight difference: The Dow has only five technology components (Apple, Microsoft, Intel, IBM, Cisco), representing about 18% of its total weight. The Nasdaq, by contrast, is heavily weighted toward mega-cap tech stocks, many of which have seen AI-driven enthusiasm sustain their rallies.
- Price-weight bias: As a price-weighted index, the Dow gives outsized influence to high-priced stocks like Boeing (trading around $230) and Caterpillar ($180). When these stocks, both industrials, pulled back in April, the Dow fell disproportionately compared to a market-cap-weighted index.
- Sector composition: The Dow has a larger allocation to financials, industrials, and healthcare than the S&P 500. While financials outperformed, industrials were volatile, and healthcare benefitted from defensive rotation but not from rate-sensitive growth.
Key divergence moments:
The Dow peaked on March 17, roughly five trading days before the S&P 500 which topped on March 24. The two indices diverged most sharply in the April sell-off: the Dow lost 4.5% from peak to trough, while the S&P 500 lost only 3.1%, and the Nasdaq actually held positive territory for most of the month before slipping 1.8%.
This divergence suggests that the Dow's more cyclical composition makes it more sensitive to growth scares. When the March ISM services report dipped to 50.2 (barely expansionary), industrials and financials sold off. Tech stocks, by contrast, continued to be supported by AI-related capital expenditure plans.
What this means for your portfolio:The Dow's YTD underperformance is not a signal to avoid large-cap value. Rather, it reflects a tactical rotation trade that could reverse if the Fed does cut rates again or if industrial orders pick up. Investors with a value tilt may view the Dow's YTD pullback as a potential entry point, while growth investors should monitor whether AI enthusiasm can justify the Nasdaq's premium.
Dow Jones YTD Tracker
Follow the DJIA year-to-date with sector breakdowns, technical levels, and analyst commentary.
READ THE FULL YTD ANALYSIS →3. Key Technical Levels and Events to Watch for the Remainder of 2026
Critical support and resistance levels
Technical analysis of the DJIA's YTD price action identifies several levels that will likely determine the index's direction for the rest of 2026:
- Resistance at 44,280 (March 17 record high): A break above this level on strong volume, ideally accompanied by improving breadth, would signal the April corrections are over and resume the year's uptrend.
- Support at 41,800 (February 21 low): This area marks the early-2025 consolidation zone. A close below 41,800 would break the YTD uptrend established since the January rate cut. A move below 40,650 (2025 close) would put the index in negative territory year-to-date.
- The 50-day moving average (~42,500) and 200-day moving average (~41,200): The Dow is currently trading just above its 50-day MA after briefly dipping below it on April 18. The 200-day MA remains well below current prices, a bullish structural signal, but one that could be tested if the global earnings outlook weakens.
Upcoming catalysts that could shift the Dow's YTD trajectory:
| Event | Date | Potential Market Impact |
|---|---|---|
| April CPI release | May 14, 2026 | Sticky CPI could fully price out remaining 2026 rate cuts, hitting financials and industrials |
| FOMC meeting (June 10-11) | June 2026 | Any hint of a rate hike would reverse the YTD narrative; a dovish hold would likely lift the Dow |
| Q2 earnings season | July-August 2026 | Industrial and financial earnings will be key test of the Dow's growth story; elevated expectations need to be met |
| US presidential election | November 2026 | Historical patterns show the Dow tends to drift sideways in election years, but sectors can diverge sharply |
For a broader look at how the economic calendar might affect your portfolio over the next 12 months, see our guide to .
Dow Jones YTD Tracker
Follow the DJIA year-to-date with sector breakdowns, technical levels, and analyst commentary.
READ THE FULL YTD ANALYSIS →4. Strategies: What the Dow's YTD Action Means for Your Portfolio
The Dow's 2026 YTD performance offers several actionable lessons. Whether you are a long-term buy-and-hold investor or a more tactical trader, the index's sector rotation and technical setup can inform your approach for the rest of the year.
Core portfolio implications:
The Dow's YTD gains are concentrated in financials and industrials, while technology has lagged. This suggests an overweight to cyclicals may continue to pay off if the US economy avoids recession. However, the April pullback shows these sectors are vulnerable to macro shocks, a risk that will persist until inflation falls more clearly toward 2%.
Potential hedges:
If you own Dow-tracking ETFs (like DIA) or individual components, consider these hedges given the YTD pattern:
- Put spreads on the Dow around the 44,000 level to protect against a wide pullback.
- Long positions in defensive sectors (utilities, consumer staples) if you expect rates to stay higher for longer.
- Shorting the Dow against the Nasdaq as a pair trade if you anticipate continued tech outperformance.
Tactical entry and exit points:
For investors adding to or trimming Dow positions:
- Consider adding to positions around the 42,000-42,500 range (near the 50-day MA) if earnings season delivers strong industrial results.
- Consider reducing exposure or hedging if the Dow breaks below 41,800 on high volume.
- Watch the relationship between the Dow and the 10-year Treasury yield. Historically, the Dow performs best when the 10-year is between 4% and 5% and the slope of the yield curve is positive, current conditions fit this pattern.
Expert Tips
- Use the Dow's YTD sector breakdown to identify whether your portfolio is overweight or underweight the sectors driving returns (financials) versus those lagging (tech).
- Set price alerts at the key levels mentioned above (44,280 resistance, 41,800 support) to take action swiftly on breakouts or breakdowns.
- When evaluating any Dow component's YTD return, consider the price-weight bias, a stock trading at $200 has roughly four times the influence of a $50 stock in the index.
- If you invest in the Dow via ETFs, use options strategies (protective puts) during periods of high uncertainty, such as around FOMC meetings and CPI reports.
Mistakes to Avoid
- Looking only at the Dow's headline YTD number without understanding sector composition. A +5.8% index return can mask significant dispersion across components.
- Ignoring the price-weight bias. The Dow's YTD return is not a simple average of its 30 components, high-price stocks dominate.
- Assuming the Dow's relationship with the S&P 500 will hold. The two indices have diverged significantly meaning the Dow's YTD pattern may not reflect overall large-cap performance.
- Overreacting to short-term pullbacks. The Dow's April decline of 4.5% is within the range of normal corrections during a bull market.
Pros and Cons
👍 Pros
- The Dow's YTD performance through May reflects genuine earnings growth in financials and industrials, with strong fundamentals supporting the rally.
- The index's more defensive composition compared to the Nasdaq may offer relative stability if tech enthusiasm fades.
👎 Cons
- Price-weight bias can make the Dow less representative of the broader large-cap market.
- The YTD underperformance vs. the S&P 500 and Nasdaq suggests a narrow market leadership that can reverse.
- Geopolitical and inflation uncertainty remain elevated, raising the risk of further pullbacks in the Dow's more cyclical sectors.
Bottom Line
The Dow's 2026 year-to-date performance of roughly +5.8% reflects a constructive but uneven growth environment. The index has successfully rotated from tech into financials and industrials, but the April setback shows the market remains sensitive to inflation and rate surprises.
For long-term investors, the Dow's YTD trajectory supports maintaining diversified exposure to cyclicals balanced with defensive hedges. Tactical traders should watch the 44,280-41,800 range for directional signals. The next major test will come with June's FOMC decision and Q2 earnings, both of which will determine whether the Dow can reclaim its record high or will finish the year closer to its current level.
Frequently Asked Questions
Through May 9, 2026, the Dow Jones Industrial Average (DJIA) is up approximately 5.8% year-to-date, closing at approximately 42,900. The index hit a record high of 44,280 on March 17 before retreating 3.1% during an April pullback driven by geopolitical tensions and sticky inflation data.
Financials are the clear leader, with components JPMorgan up roughly 14% and Goldman Sachs up about 18% year-to-date. Industrials like Caterpillar (+11%) and Boeing (+8%) have also contributed. Healthcare stocks UnitedHealth and Johnson & Johnson have added defensive support. Technology components Apple (-3%) and Microsoft (-1%) have lagged.
The Dow's underperformance stems from its different sector composition, the Dow has a heavier weight in cyclical sectors (financials, industrials) and less exposure to mega-cap tech. As a price-weighted index, high-priced stocks like Boeing and Caterpillar have outsized influence. The Nasdaq, by contrast, benefitted from continued AI enthusiasm and lower sensitivity to rate-hike fears.
Resistance sits at the March 17 record high of 44,280. A break above that level on strong volume would signal a resumption of the uptrend. Key support is at 41,800, the February 2026 low. A close below that would break the YTD uptrend and could open the door to a test of the 2025 close at 40,650. The 50-day moving average is around 42,500, and the 200-day moving average near 41,200.
The Dow's 5.8% gain through early May 2026 is positive but below the 8.4% gain seen over the same period in 2025 and the 7.6% gain in 2024. However, it is above the average first-quarter gain of roughly 2-3% during the 2010-2019 bull market. The YTD performance suggests a solid but more volatile market compared to recent years.
🔭 Explore More Topics
- Dow Jones Industrial Average index data via S&P Dow Jones Indices, accessed May 10, 2026.
- Federal Reserve FOMC statement and minutes, January and March 2026 meetings.
- Sector and component returns from publicly-available market data via Bloomberg and Yahoo Finance, as of May 9, 2026.
Related topics: dow jones year to date, DJIA YTD 2026, Dow Jones performance 2026, Dow YTD return, Dow Jones sectors 2026, What is the Dow Jones Industrial Average year-to-date?, Why is the Dow down in April 2026?, Dow Jones technical levels May 2026, Dow vs S&P 500 YTD, Best Dow ETFs to buy 2026, Dow Jones record high 2026
↑ Back to Top


