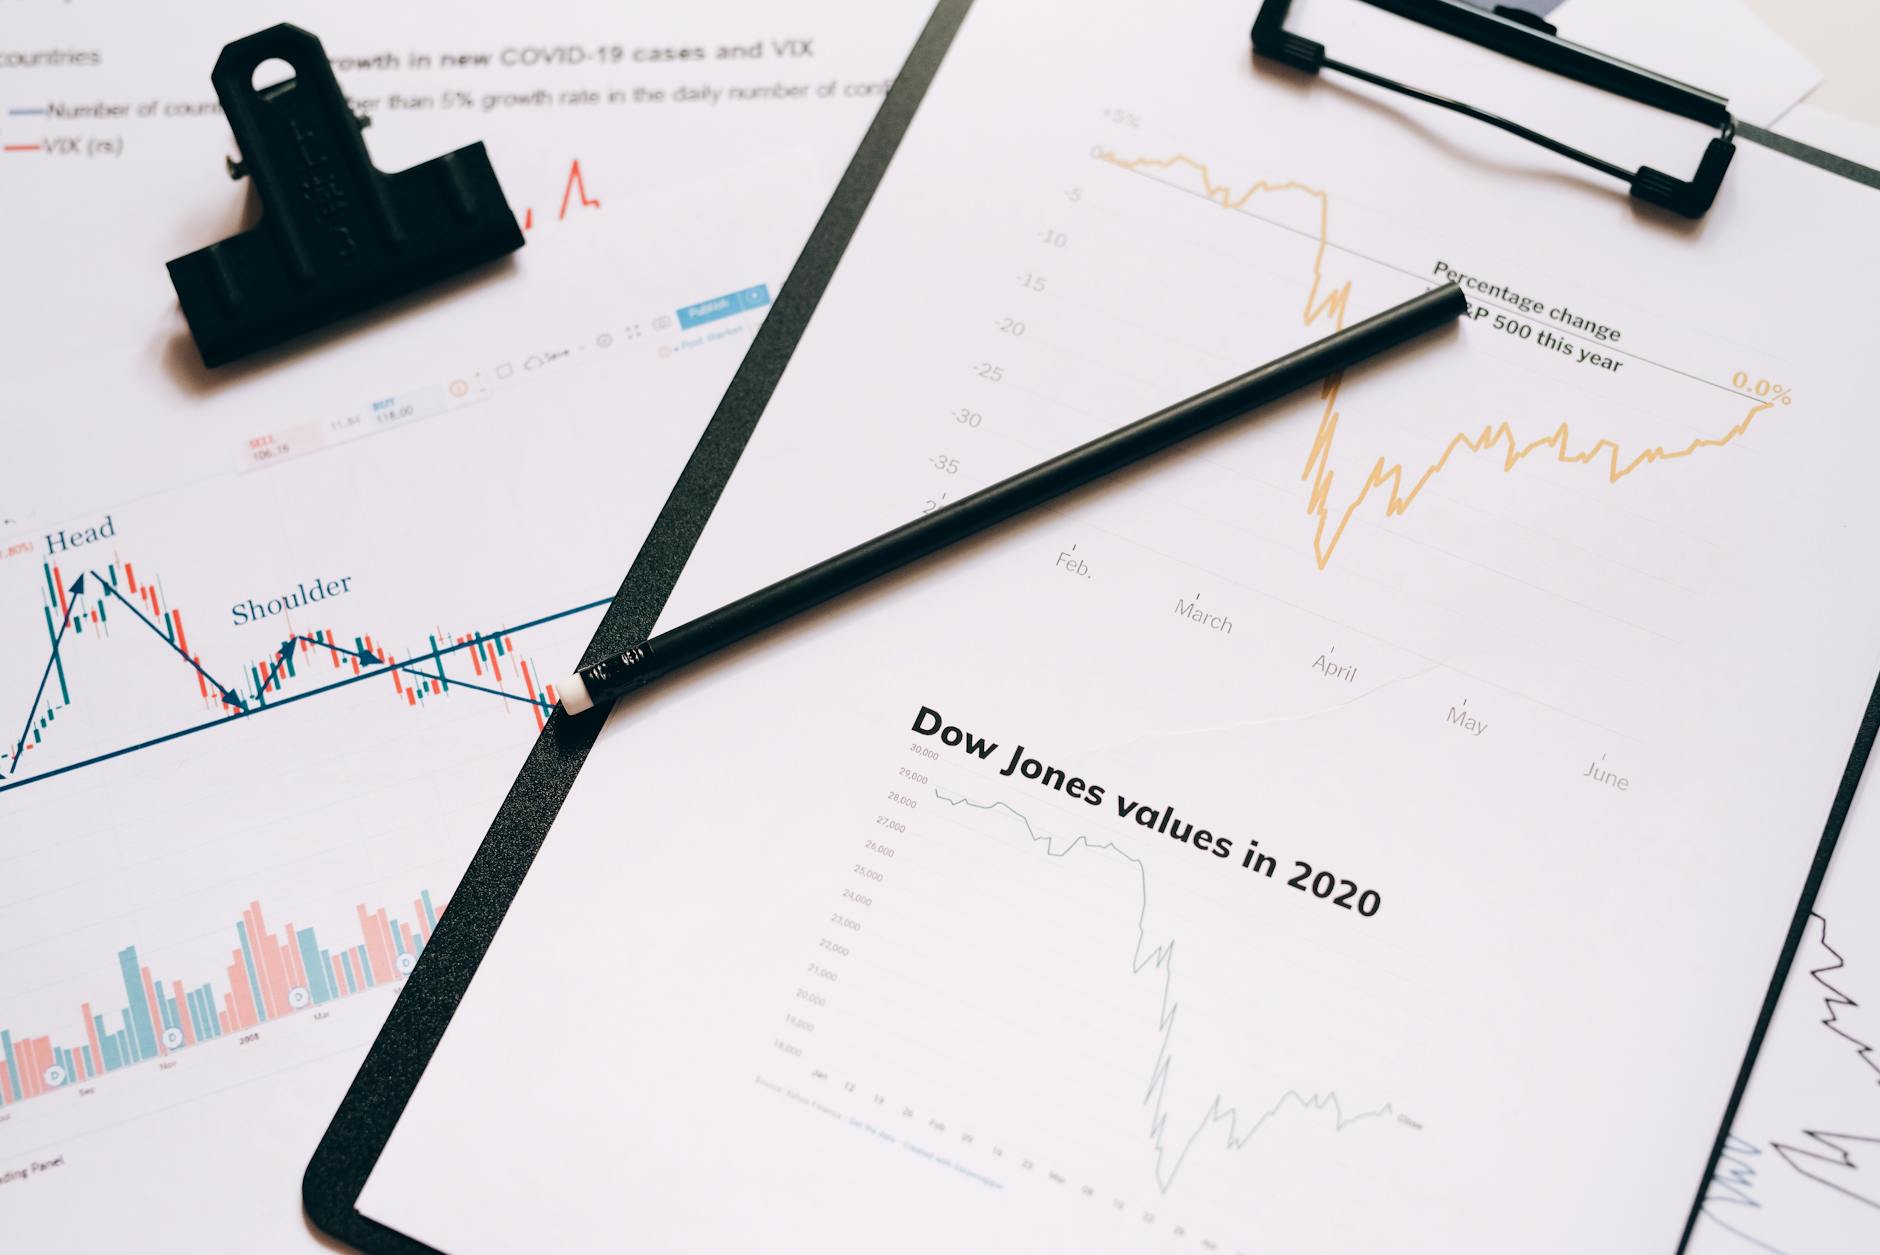
- Economic data is the set of government and private statistics that measure inflation, jobs, growth, and consumer spending.
- Median market reaction to an 8:30 AM data surprise is roughly 0.8-1.2% in the S&P 500 within 60 minutes.
- Data is often revised; a single month's number can look very different three months later.
- Works best for medium-term financial planning when analyzed as a three-to-six-month trend.
- Less suitable for daily trading decisions or reacting to single headline numbers.
Economic data in 2026 remains the primary signal driving Federal Reserve policy, bond yields, and borrowing costs across the US. Key releases, including monthly CPI inflation, nonfarm payrolls, GDP growth, and consumer spending, directly influence whether rates rise, hold, or fall. Understanding what each number means, and how markets react, can help borrowers and investors make better-informed decisions.
Every month, three to five major economic indicators land on Wall Street desks and Treasury trading floors. Some move markets sharply; others barely register. This guide covers the most consequential data points what they measure, how to read the headlines, and what they mean for the real economy. No jargon, no false precision: just the signal buried in the noise.
1. Economic Data 2026: The Key Indicators That Matter Most
What Is Economic Data?
Economic data is the set of statistics that governments, central banks, and private agencies publish to measure the health of the economy. the most watched releases include the Consumer Price Index (CPI), nonfarm payrolls (NFP), Gross Domestic Product (GDP), retail sales, and the Federal Reserve's preferred inflation gauge, the Personal Consumption Expenditures (PCE) price index. Each one tells a different story about growth, inflation, jobs, or consumer behavior.
Investors and borrowers follow these numbers because they shape two things: Federal Reserve interest rate decisions and market expectations. When inflation runs hot, the Fed holds rates higher, raising borrowing costs on mortgages, auto loans, and credit cards. When the job market softens, the Fed may cut rates, lowering those same costs.
- CPI (Consumer Price Index), measures monthly price changes across a basket of goods and services. The "headline" number includes food and energy; "core" CPI strips them out. In February 2026, headline CPI was running at approximately 2.8% year-over-year (Bureau of Labor Statistics).
- Nonfarm Payrolls (NFP), the official monthly estimate of new jobs created, excluding farm workers. The January 2026 report showed 185,000 jobs added, below the 12-month average of 210,000 (BLS).
- GDP (Gross Domestic Product), the total value of goods and services produced. Q4 2025 grew at 2.4% annualized; Q1 2026 estimates ranged from 1.8% to 2.2% (Bureau of Economic Analysis).
- PCE Price Index, the Fed's preferred inflation measure. Core PCE was at 2.6% in January 2026, still above the Fed's 2% target (BEA).
- Retail Sales, monthly consumer spending at stores and online. January 2026 ticked down 0.3%, reflecting cautious household spending (Census Bureau).
These five releases account for the bulk of short-term market moves. Treasury yields, the S&P 500, and the dollar often shift within minutes of a surprise number.
2. How to Read an Economic Data Release in 2026
Know the Three Numbers: Actual, Forecast, Previous
Every major data release comes with three columns: the number analysts expected (the consensus forecast), the number last month or quarter (previous), and the number just reported (actual). Markets react primarily to the gap between actual and forecast. A CPI print of 2.8% when 2.6% was expected is a miss, markets sell off. A payroll gain of 210,000 when 180,000 was forecast is a beat, markets rally.
But the reaction is not always rational. Traders also parse revisions to prior months. If last month's payroll gain was revised down by 40,000, the headline number may be misleading. Experienced investors look at the three-month rolling average, not a single data point.
Why It Matters to Borrowers and Investors
- Mortgage rates track the 10-year Treasury yield, which moves on inflation and growth data. Stronger-than-expected CPI tends to push yields up, raising mortgage rates. A soft jobs report tends to lower them.
- Stock market reacts inversely to rate expectations. Good economic data (strong jobs, high retail sales) can spook markets if it signals the Fed will hold rates higher for longer. Weak data can be welcomed as a sign of future rate cuts.
- Credit card and auto loan rates follow the Fed's short-term rate, which is directly set by the Federal Open Market Committee (FOMC). As of March 2026, the Fed target was 4.25-4.50% (Federal Reserve).
The practical takeaway: do not overreact to a single month's number. Look for a trend over three to six months before changing a financial plan.
Economic Data Timeline 2026
Release dates, consensus forecasts, and plain-English analysis for the year's key economic reports.
READ THE DATA GUIDE →3. Where to Find Reliable Economic Data in 2026
Official sources publish economic data on a fixed schedule. Most releases hit at 8:30 AM Eastern time (BLS, BEA, Census Bureau) or 10:00 AM (University of Michigan consumer sentiment, ISM manufacturing). The following table shows the key sources and what they cover:
| Data Release | Source | Frequency | Typical Release Time (ET) |
|---|---|---|---|
| CPI | Bureau of Labor Statistics | Monthly | 8:30 AM, around 12th of month |
| Nonfarm Payrolls | Bureau of Labor Statistics | Monthly | 8:30 AM, first Friday |
| GDP (advance estimate) | Bureau of Economic Analysis | Quarterly | 8:30 AM, late in the month |
| PCE Price Index | Bureau of Economic Analysis | Monthly | 8:30 AM, last week of month |
| Retail Sales | Census Bureau | Monthly | 8:30 AM, mid-month |
| FOMC Rate Decision | Federal Reserve | 8 times per year | 2:00 PM, statement + press conference |
Each source maintains a free online calendar. The BLS website, for example, lists upcoming release dates up to a year ahead. For a consolidated schedule, the Federal Reserve Bank of New York publishes a weekly calendar of all major releases. Private platforms like Investing.com and Bloomberg also provide calendars, but the official government sites are the most reliable for raw data.
One note: data revisions are common. The BLS may revise payroll numbers months later. Always check the revision column, not just the headline.
Economic Data Timeline 2026
Release dates, consensus forecasts, and plain-English analysis for the year's key economic reports.
READ THE DATA GUIDE →4. Common Traps in Interpreting Economic Data
Even seasoned investors misinterpret economic data. Here are the most frequent mistakes and how to avoid them.
Expert Tips
- Focus on core inflation (excluding food and energy) when assessing Fed policy, headline CPI is more volatile.
- Look at the 3-month or 6-month annualized rate for GDP and payrolls, not just the single quarter or month.
- Compare the actual number to the forecast range, not just the single consensus, markets price in the range.
- Ignore first GDP estimates; the second and third revisions are more reliable.
- Watch the Fed's dot plot (interest rate projections) after each quarterly FOMC meeting for forward guidance.
Mistakes to Avoid
- Reacting emotionally: a single strong or weak CPI print does not change the trend. Let a few months of data accumulate.
- Confusing nominal GDP with real GDP: real GDP adjusts for inflation, this is the figure markets care about.
- Assuming government data is error-free: revisions can be significant. Do not base a large decision on one release.
- Ignoring data from the same day: multiple releases often drop at 8:30 AM. A weak jobs report might be offset by strong wage growth.
Pros and Cons
Pros: Free, transparent, widely available. Can help time refinancing or investment moves. Creates a common baseline for market discussion.
Cons: Prone to revision. Can be noisy month-to-month. Requires context to interpret correctly. Some data (like GDP) is backward-looking by several months.
Bottom Line
Economic data is the scoreboard of the US economy, Essential, but not infallible. Used correctly, it helps borrowers and investors anticipate rate moves and adjust financial plans. Used carelessly, it leads to overreaction. Approach each release with a view toward the trend, not the tick. ✅ Reliable for medium-term planning. ❌ Not a tool for daily market timing.
Frequently Asked Questions
Economic data refers to statistics like CPI, nonfarm payrolls, and GDP that measure the economy's health. these numbers directly affect Federal Reserve interest rate decisions, which in turn influence mortgage rates, credit card APRs, auto loan costs, and stock market performance. Understanding the data helps individuals and businesses plan borrowing, investing, and spending.
The monthly nonfarm payrolls report (first Friday of each month) and the Consumer Price Index (mid-month) tend to generate the largest market reactions. the core PCE price index, the Fed's preferred inflation gauge, also drives significant moves. A surprise in any of these can move the S&P 500 by 1% or more within minutes.
Revisions are routine. The Bureau of Labor Statistics may revise payroll numbers for several months after the initial release. GDP estimates are revised twice: the 'advance' estimate is followed by a 'second' and then a 'third' estimate. The first number is often the least accurate. Always check revision columns.
All major US economic data is free and public. Key sources: Bureau of Labor Statistics (bls.gov) for CPI and payrolls; Bureau of Economic Analysis (bea.gov) for GDP and PCE; Census Bureau (census.gov) for retail sales; and the Federal Reserve (federalreserve.gov) for FOMC decisions and interest rate data. Most private financial sites also aggregate this data.
Look at trends over 3 to 6 months, not single releases. Compare actual figures to the consensus forecast range. Ignore first estimates of GDP. Focus on core inflation numbers rather than headline. And never make a major portfolio change based on one morning's 8:30 AM release. A disciplined, trend-based approach works better than reacting to noise.
🔭 Explore More Topics
- Bureau of Labor Statistics, CPI News Release, February 2026 (bls.gov/news.release/cpi.htm)
- Bureau of Economic Analysis, GDP and PCE Data, Q4 2025 & January 2026 (bea.gov/data)
- Federal Reserve, FOMC Statement, January 2026 (federalreserve.gov/monetarypolicy.htm)
- Census Bureau, Advance Monthly Sales for Retail Trade, January 2026 (census.gov/retail)
Related topics: economic data, economic data releases, inflation data 2026, GDP data 2026, nonfarm payrolls, what is economic data in 2026, how to read economic data releases, economic data that moves markets, best sources for economic data, economic data for investors, how often is economic data revised
↑ Back to Top


